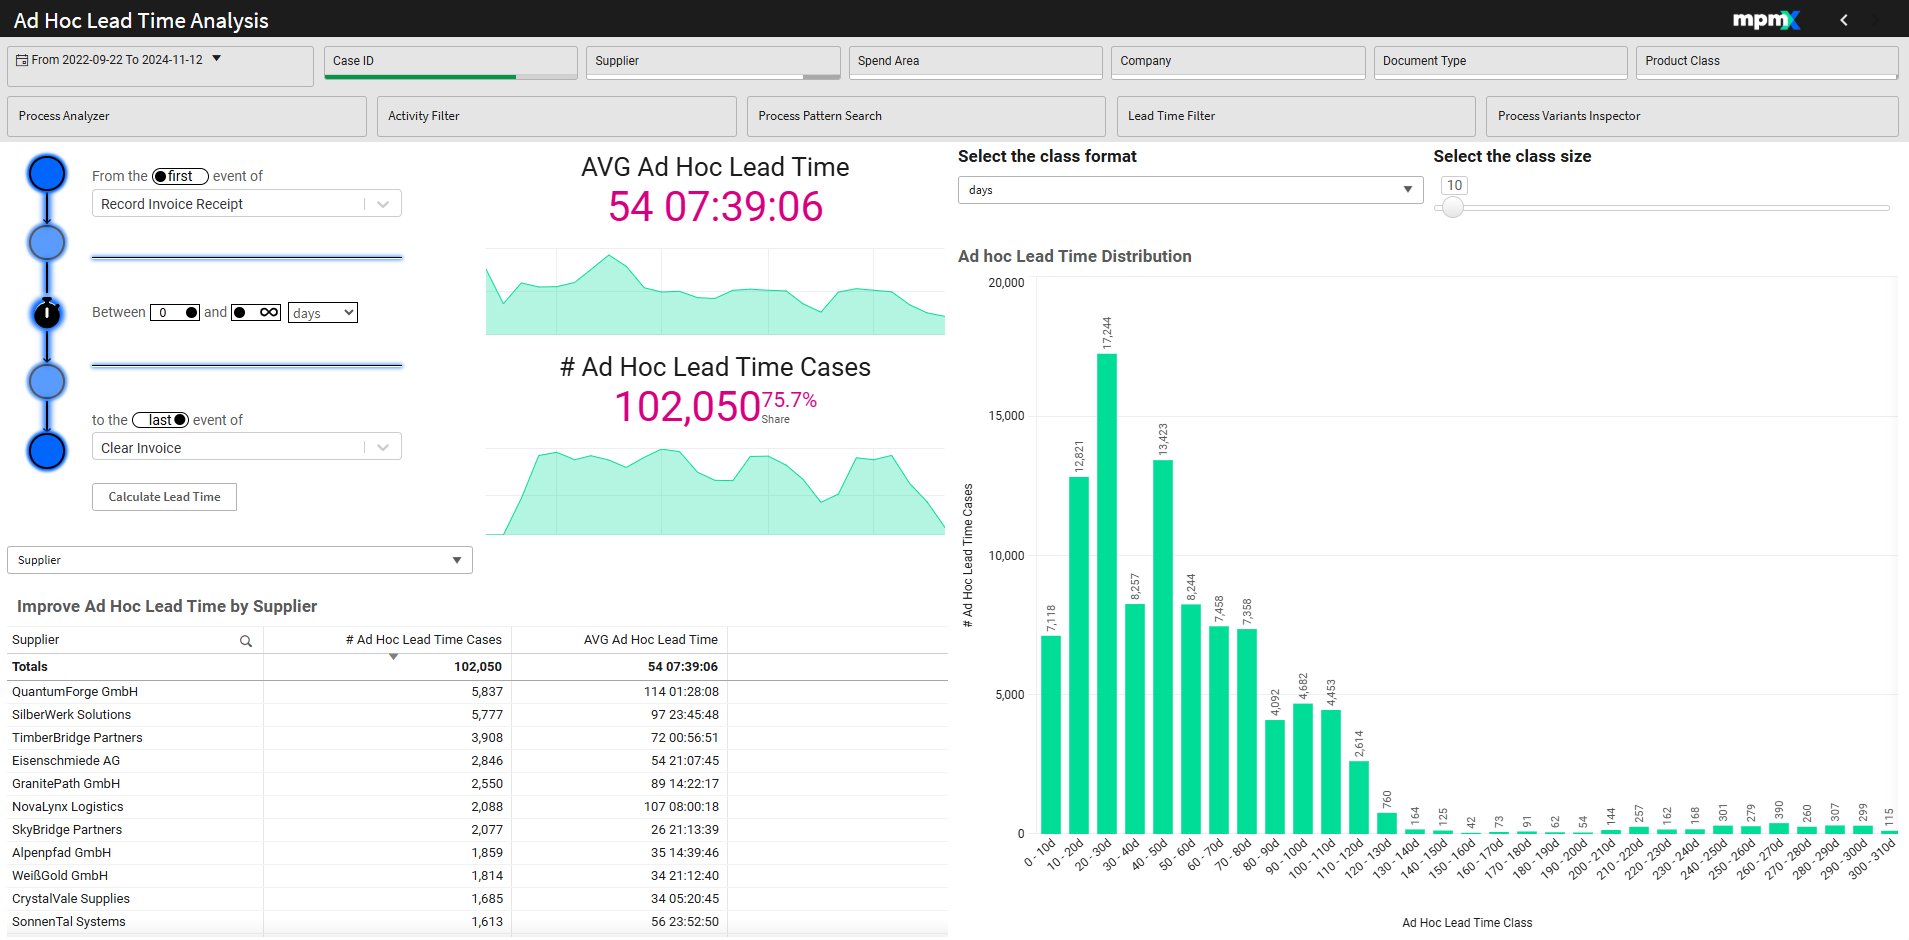
Ad Hoc Lead Time Analysis
The Ad Hoc Lead Time Analysis Sheet provides insights into lead times between any two selected process steps. Users can filter cases by specific time intervals (lead time), compare ad hoc lead time across different process contexts, and explore dynamic lead time distributions. This enables the identification of subprocesses with unusually long or short durations and supports targeted optimization of timing-sensitive activities.
For this toolsheet to work, you first need to define which subprocess or set of activities you want to analyze.
Type: Tool Sheet
Use Case
In the Purchase to Pay process you would want as much time as possible between the Invoice Receipt and Payment, without exceeding the payment deadline. This allows a company to keep its liquidity high without incurring any late fees.
In this situation use the Ad Hoc Lead Time Analysis sheet to identify cases paid too quickly and also too slowly.
Lead Time Filter
- Select the start and end activities.
- Decide if you wish to calculate time from the first occurrence or last occurence of each of the selected activities using the toggle button.
- This is used only if a case has multiple of the same activities.
- Selecting the first start activity and the last end activity will give you the longest possible duration.
- Alternatively, selecting the last start activity and the first end activity will give you the shortest possible duration.
- Select the lead time duration to filter on.
- Selecting 0 to infinity selects all time periods.
- The infinity sign can be toggled off and then change to a numeric value.
- The days option can be changed to hours or minutes
- You can focus on extra long lead times by entering a time period that would be considered long for your process, e.g. between 25 and 70 days.
- Alternatively, you could enter a short period to highlight the cases that perform those steps the quickest, e.g. between 0 and 5 hours.
- Click the Calculate Lead Time button to update the KPIs.
It is important to note that the Lead Time Filter will operate on any previously applied filter. So you could first apply a filter for Supplier (for example) and then do a Lead Time Filter on only that supplier's cases.
Key Figures
- Ad Hoc Lead Time: Shows the average duration between the selected start and end activity across all filtered cases.
- # Ad Hoc Lead Time Cases: Shows the total number of cases that match the filter applied (Additional Metric: Percentage share of these cases compared to the total number of cases).
Improve Ad Hoc Lead Time by (Dimension) Table
- Select a dimension from the dropdown menu
- Here you can see detailed case and lead time information for each item in the list.
- The columns can be sorted to quickly find the longest/shortest lead time or most cases affected to help pinpoint where action should be taken.
Ad Hoc Lead Time Distribution Chart
Visualizes the distribution of filtered cases across time intervals. The intervals/class sizes (e.g., 0 - 10 days, 10 - 20 days, 30 - 40 days, etc.) and the class format (days, hours, minutes) are configurable. This offers a nice visual of all the cases in the selected filter broken down by time interval.
Configuration Parameters
- Select the class format: Select whether you want the groups in the bar chart below shown in days, hours, or minutes.
- Select the class size: Define how long a time period will be used for the distribution groupings in the bar chart.